What’s more unpredictable - your business’s cash flow or next week’s weather? You can’t control the weather. But your business’s financial performance? That’s on you.
With financial forecasting, you can take control of your business’s finances. You just need the right financial forecasting model so you can set the foundation of smart and continuous financial management.
But what are the different models? And which is the ideal one? In this blog, we’ll answer all these questions so you can begin forecasting today!
What are financial forecasting models?
Financial forecasting models also referred to as financial forecast methods are processes businesses use to analyze historical financial information and predict future outcomes. These terms, models and methods, are often used interchangeably.
At their core, financial forecasting helps businesses analyze older financial statements and data to predict future business performance, helping them prepare for what’s coming by focusing on areas like future revenue, expenses, and customer demand.
Some forecasting methods are straightforward, like checking last year’s sales to predict next year’s growth. Others use more advanced techniques, studying patterns and relationships in data to make sharper, more accurate financial forecasts.
Whether the goal is to plan budgets, improve cash flow, or raise capital, these processes give businesses the information they need to make smart business decisions.
Learn more about what financial forecasting is and how it helps businesses make informed decisions.
Qualitative vs. quantitative forecasting models
When it comes to the financial forecasting process, businesses often take one of two approaches: Quantitative forecasting or qualitative forecasting. Both methods aim to predict upcoming financial performance, but they do it in very different ways.
Quantitative forecasting
Quantitative financial forecasting refers to hard data. It looks at historical data like sales figures, website traffic, advertising budgets, as well as financial reports and uses financial modeling to project future trends. This approach is great if you want to spot seasonal patterns, identify shifts in demand, and make data-backed decisions. If you’re looking for concrete answers and measurable trends, this is where you should start.
Qualitative forecasting
It leans on market research and expert opinions rather than hard data. It’s particularly useful when businesses don’t have older financial data to analyze. Like when launching a new product or entering a new market. It taps into consumer behavior through surveys and focus groups to assess demand and preferences.
So, which method is better? It depends.
Quantitative forecasting works well when you have reliable past data to study, and it often appeals to stakeholders who want investment-based research. But the other fills in the gaps, especially when you need insights that go beyond the numbers like shifts in consumer preferences or cultural trends. It complements quantitative methods by adding a layer of market research and human judgment to accurate forecasting.
However, even the most reliable methods can fail without careful planning—making it important to avoid financial forecasting mistakes like ignoring seasonality or relying too heavily on past business performance.
| Qualitative forecasting | Quantitative forecasting |
|---|---|
| Based on expert opinions, market research, and consumer behavior insights. | Uses historical data, statistical analysis, and mathematical models for predictions. |
| Doesn’t rely on old financial information making it ideal for new products or startups. | Requires past financial details and statements for data-driven predictions. |
| Delphi method, surveys, focus groups, and market research. | Simple linear regression, multiple linear regression, moving averages, and percent of sales. |
Now that we know what qualitative and quantitative forecasting means, let us dive into some of the most widely used forecasting methods.
10 financial forecasting methods for smarter business decisions
Not all forecasting methods are built the same. But what they all have in common is their ability to help you make smart decisions.
Here’s a closer look at the different types of financial forecasting methods and how they can support your business strategies.
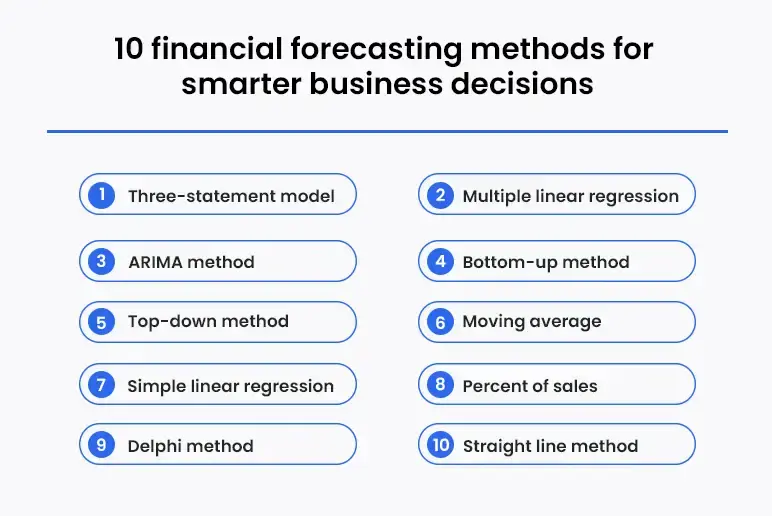
1. Three-statement model
The three-statement model connects the cash flow statement, income statement, and balance sheet to provide a comprehensive view of a company’s financial performance and position.
This model is particularly helpful for assessing profitability, solvency, and cash flow management by showing how the three statements interact.
Example: A manufacturing company wants to determine whether it can fund a planned expansion.
- It forecasts future revenues and expenses using older financial data to project profits through the income statement.
- Next, it examines its assets and liabilities via the balance sheet to evaluate its financial position and solvency.
- Finally, it forecasts liquidity using the cash flow statement to determine if it has enough liquidity or needs to consider raising capital.
Pros
- Provides a comprehensive view of the company’s financial outcomes and business performance in the future.
- Supports budgeting, investment research, and planning finances.
Cons
- Requires existing financial details and detailed financial modeling, making it time-consuming.
- Outputs depend on the quality of already present financial data and market scenario.
Best for:
It’s widely used by finance teams, investment analysts, and corporate planners to assess future financial performance.
2. Multiple linear regression
Multiple linear regression is an advanced forecasting method that analyzes the relationship between dependent variables (what you want to predict) and two or more independent variables (factors influencing the prediction).
It studies how each independent variable impacts the dependent variable and assigns a coefficient to show the strength of each influence. These influences are then combined to predict the future based on historical data and previous financial statements.
For example, a hotel chain wants to predict its monthly sales. It examines several factors, such as occupancy rates, seasonal demand, advertising spend, and local events. By analyzing how each of these factors impacts revenue, the hotel can forecast future income for the upcoming months. This helps with pricing strategies, staff scheduling, and inventory planning for food and supplies.
Pros
- Considers multiple factors (dependent and independent variables) simultaneously for more precise forecasts.
- Suitable for detailed predictions involving several variables.
Cons
- Requires large datasets and older financial data for reliable results.
- Missing or incomplete data can lower accuracy.
Best for:
It’s widely used in finance, marketing, and operations to predict outcomes like stock prices and sales performance or identify trends.
3. ARIMA method
For businesses dealing with time-sensitive trends and seasonal patterns, ARIMA offers an advanced approach to financial forecasting. It’s designed to handle data with trends, cycles, and seasonality. Unlike multiple linear regression, ARIMA captures patterns that evolve over time, making it ideal for predicting future values based on past data.
Example: A subscription-based video streaming service wants to forecast monthly subscriber growth. Historical data shows seasonal spikes during winter months and drops in summer.
- The AR (AutoRegressive) component identifies relationships between past subscriber counts and future trends, recognizing that growth typically slows after promotional periods.
- The I (Integrated) component adjusts the data for seasonal trends, ensuring the model accounts for recurring patterns.
- The MA (Moving average)component corrects errors from prior forecasts, improving prediction accuracy.
Thus, the name ARIMA.
This will predict subscriber growth for the next 12 months, helping the business plan marketing campaigns and server capacity during peak periods.
Pros
- Handles trends, cycles, and seasonality better than simpler models.
- Ideal for time-sensitive forecasts like monthly or quarterly projections.
Cons
- Requires technical expertise to implement.
- Needs data preprocessing to remove irregularities for accurate results.
Best for:
Businesses with seasonal demand (e.g., retail, travel, and SaaS) and long-term financial planning and cash flow projections.
4. Bottom-up method
Bottom-up forecasting takes a detailed and granular approach to financial forecasting by starting at the department or team level and building up to create an overall financial outlook. It taps into the insights of teams directly involved in sales, production, and customer interactions.
Example: If a retail chain wants to forecast revenue for the next quarter, its sales team will first estimate it can reach 5,000 customers through advertising and promotions. Based on previous data, they expect 10% conversion rates, leading to 500 purchases. With an average order value of $50, they forecast:
500 purchases × $50 = $25,000 in revenue
Pros
- Focuses on detailed inputs from teams closest to the business, improving accuracy and realistic forecasting.
- Accounts for current market scenario and customer behavior.
Cons
- Time-consuming since it requires input from multiple teams.
- Depends heavily on team expertise, which can lead to biased results if assumptions are inaccurate.
Best for:
It is best for startups, small to medium-sized businesses, and companies focused on specific sales goals or short-term forecasts.
5. Top-down method
Top-down forecasting starts with a high-level view of the market or industry and then narrows it down to predict a company’s financial performance. It uses old data, the company’s historical growth rate, and economic indicators to estimate the total addressable market (TAM) and then applies a percentage to determine the company’s potential market share.
Example: A software company wants to forecast revenues for a new product.
- It estimates the total addressable market (TAM) to be $10 billion based on market research and industry growth rates.
- It assumes it can capture 2% of the market within the first year.
Forecasted revenue = 2% × $10 billion = $200 million
Pros
- Provides a big-picture view that aligns with strategic goals.
- Faster and easier to create than bottom-up forecasts.
Cons
- Relies heavily on market situations and may overlook specific operational constraints.
- Assumes market share percentages, which can be overly optimistic or unrealistic.
Best for:
It’s useful for corporate planning, long-term growth strategies, and businesses aiming to assess high-level performance financially across multiple divisions or markets.
6. Moving average
The moving average method evaluates financial metrics like revenues, profit margins, and growth rates by calculating averages over a specific period. This method works best for short-term forecasts and trend analysis.
Here, you have to calculate the average values from recent times, such as months or quarters, to predict future cash liquidity. The data is continuously updated, so the “moving” average shifts forward with each new data point.
Example: A retail store wants to forecast weekly foot traffic based on the last three weeks’ data - 500, 550, and 600 visitors.
Forecasted Traffic = (500 + 550 + 600)/3
Forecasted Traffic = 550 visitors
This estimate helps the store plan staff schedules and inventory restocking based on expected demand.
Pros
- Easy to calculate and apply for short-term planning.
- Smooth out fluctuations to identify patterns in data.
Cons
- Slow to adjust to sudden shifts or trends.
- Doesn’t account for market changes, seasonality, or industry disruptions.
Best for:
The moving average method is used by retailers, service businesses, and manufacturers to monitor sales, expenses, and demand patterns.
7. Simple linear regression
Simple linear regression predicts future finances based on the relationship between two variables - dependent variables (what you want to predict) and independent variables (what influences the prediction). Based on the independent and dependent variables, the linear relationship creates a trend line that shows how changes in one variable affect the other.
An example of simple linear regression can be a gym wanting to predict its electricity costs based on its monthly sales. Past data shows that as memberships increase so do electricity bills. If a 10-member increase has led to an average $200 rise in utility costs each month, the gym can use this trend to estimate future costs as memberships continue to grow.
Pros
- Requires basic statistical tools and minimal setup.
- Clearly shows patterns in growth or expenses.
Cons
- Limited to linear relationships and can’t handle complex independent or dependent variables.
- Works best with consistent trends, not fluctuating numbers.
Best for:
It’s best for small businesses and startups with predictable trends in expense projections, and finance planning.
8. Percent of sales
Percent of sales predicts future revenues, expenses, and profits based on the business’s historical relationship to sales. It assumes that certain expenses, like cost of goods sold (COGS) or operating costs, will grow at the same rate as sales.
This method is often used to create pro forma statements, helping businesses plan budgets and track the company’s financial performance.
The process involves analyzing past financial statements and data and calculating each expense as a percentage of sales. Businesses then apply the same percentage to forecast future numbers.
Example: A wholesale distributor forecasts $200,000 in sales for next year. Historically, the cost of goods sold (COGS) has been 40% of sales.
Forecasted COGS = 40% × $200,000
Forecasted COGS = $80,000
Pros
- Ideal for short-term budgeting and forecasting.
- Scales metrics proportionally with sales trends.
Cons
- Doesn’t consider market situations or economic shifts.
- Works only when financial relationships remain steady over time.
Best for:
It’s widely used in retail, wholesale, and manufacturing, where expenses typically scale with revenue. It’s also useful for creating pro forma statements for budgeting or planning finances.
9. Delphi method
The Delphi method gathers insights from industry experts to predict a company's performance based on market and emerging trends, just like statistical forecasting. It is widely used in financial forecasting when there is little or no past data available, making it especially useful for new product launches.
The Delphi method involves:
- A facilitator sends questionnaires to a panel of experts regarding market conditions, consumer behavior, and financial performance.
- Experts provide forecasts based on market research and their professional experience.
- The facilitator compiles the results and circulates the findings among participants for further evaluation.
- This process repeats until a consensus is reached.
Example:
A tech startup wants to predict future revenues for a mobile app launch but lacks historical financial information. The company consults industry experts to analyze market and consumer preferences.
Pros
- Useful when old data is unavailable or limited.
- Incorporates expert knowledge and market research for accurate financial forecasting.
Cons
- Time-consuming due to multiple rounds of feedback.
- Not ideal for quantitative forecasting requiring statistical forecasting or financial modeling.
Best for:
The Delphi method is best for businesses entering new markets, launching new products, or developing strategies without past financial information.
10. Straight line method
The straight line forecasting method is one of the simplest financial forecasting methods for predicting future growth. It’s based on the idea that if your business grew steadily before, it’s likely to keep growing at the same pace and use historical financial data to predict future outcomes.
An example of a straight line method can be a retail store that has grown its sales by 8% per year over the past three years. Using this method, it assumes an 8% growth for the next year. If this year’s revenue is $100,000, the straight line method predicts $108,000 next year and $116,640 the year after.
Pros
- Requires minimal calculations and is easy to implement.
- Works well for planning finances, staffing, and inventory management.
Cons
- Doesn’t account for market conditions like economic shifts, disruptions, or sudden growth.
- Not suitable for businesses with irregular growth patterns or startups with no past data.
Best for:
The straight line method is particularly useful for small to medium-sized companies looking for quick insights to manage budgets and plan short-term strategies.
There you have it - some of the best financial and accurate forecasting models used by different industry veterans.
Effective budgeting and forecasting processes ensure businesses are well-prepared for market changes and financial uncertainties. But, which one of them is ideal for you? Let’s find out.
How to choose the right financial forecasting model?
An accurate forecasting method depends on your data availability, goals, and business model. Start with what you need, choose a method that fits, and adjust as you grow.
Here is a step-by-step breakdown:
Step 1: Define your needs
Do you need a quick budget forecast for the next quarter or a long-term growth plan for the next three years?
- Short-term goals are ideal for simple models like percent of sales or straight-line forecasting.
- Long-term strategies require complex financial modeling, like multiple linear regression or the three-statement model.
If you have existing financial figures, use them. If you’re launching something new, rely on market research.
Step 2: Pick the right method
- Qualitative forecasting: Ideal for startups or new products with no past data.
Example: The Delphi Method gathers expert opinions to predict future revenues and market trends. - Quantitative forecasting: Best for businesses with past financial information looking for accurate financial forecasting.
Example: Multiple linear regression analyzes how factors like pricing and advertising spending affect the forecasting of sales.
Step 3: Match the model to your goals
- Straight-line forecasting: Use for steady growth patterns and quick projections.
- Moving average method: Focus on short-term trends and patterns.
- Bottom-up forecasting: Build detailed forecasts from team-level data for realistic estimates.
- Top-down forecasting: Get a holistic view by estimating market share from industry data.
Step 4: Test and adjust
No financial forecasting process is perfect. Test forecasts against past financial data and refine them as market conditions shift.
Let’s take an example. A retail clothing store is planning to expand its inventory for the next quarter and needs an accurate forecasting model to estimate future revenues, expenses, and profits.
Business requirements:
- Short-term budgeting for inventory purchases and marketing campaigns.
- A method that works with existing financial specifics and doesn’t require complex modeling.
- Projections that scale expenses like cost of goods sold (COGS) and advertising spend with expected sales growth.
The process:
- The store reviews its past statements:
- Sales last quarter were $100,000.
- COGS averaged 40% of sales.
- Marketing expenses averaged 10% of sales.
- It expects sales to grow by 10% next quarter, reaching $110,000.
- Using this growth estimate:
- COGS: 40% × $110,000 = $44,000
- Marketing: 10% × $110,000 = $11,000
The store chose the percent of sales forecasting method because:
- It’s quick, easy to implement, and fits businesses with steady growth trends.
- It leverages historical data and consistent expense ratios, making it ideal for short-term budgeting.
- It scales projections in line with sales growth, ensuring accurate planning of finances without requiring complex statistical tools.
Prepare accurate financial projections using AI
Thomas Siebel, CEO of C3 AI, said it best: "Enterprise AI is the key to digital transformation, enabling organizations to leverage data for predictive insights."
This perfectly captures how AI has revolutionized financial forecasting by enabling businesses to move beyond outdated spreadsheets and manual processes.
If you’re ready to make better decisions faster, Forecastia is the only AI-powered financial forecasting software you need. It’s designed specifically for businesses that aim to build accurate projections for budgets, future cash flows, and financial performance without spreadsheets.
Frequently Asked Questions
Which financial forecasting method is best for small businesses?
Moving average forecasting is one of the most effective methods for small businesses, particularly for short-term predictions. It uses the average or weighted average of previous periods to estimate future values, helping businesses track trends and seasonal changes.
Can I use financial forecasting without historical data?
Yes, financial forecasting is still possible without historical data. Creating multiple realistic scenarios builds an effective financial forecast without historical data. It allows businesses to evaluate risks, test assumptions, and make informed decisions instead of relying on guesswork.
What tools are best for beginners in financial forecasting?
For beginners, AI-powered tools like Forecastia and ChatGPT make financial forecasting simple and error-free. It eliminates the need for manual spreadsheets and offers features like AI-driven projections.

Follow Vinay Kevadiya