Xero Forecasting Software

Analyze budgets & real-time forecasts in one dashboard
Coming Soon..
Integrate your Xero account with Forecastia in minutes. Track performance, analyze trends, and forecast with confidence—all in one place.
Get Early Access
xero forecasting software

Seamless Xero X Forecastia Integration

Sync Xero with Forecastia, eliminate manual data entry work and save time. No spreadsheets are required.
xero
Connect your Xero account with Forecastia
Arrow right
forecastia logo b
Forecastia imports your accounting data into forecasts
Arrow right
accounting data
Your forecasts update with accounting data in real-time

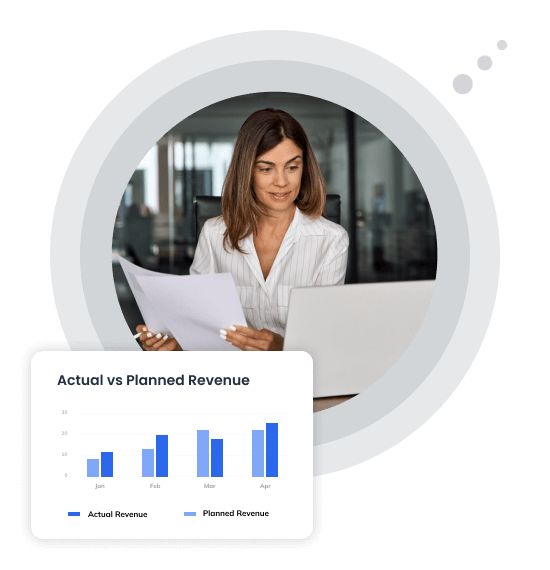
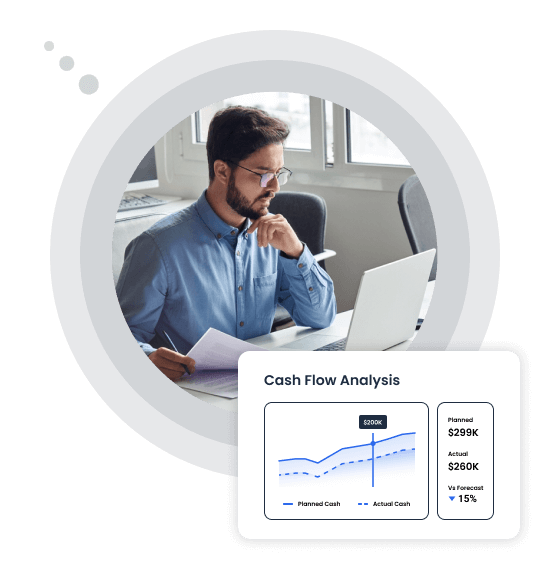
Track actual results against your forecast predictions

Tracking actual results against your projections helps you gain valuable insights into what’s working and where adjustments are needed. It helps you ensure your business is headed in the right direction.
  • Compare actual results with your predictions.
  • Identify performance gaps & recalibrate your forecasts.
  • Spot trends and patterns to adjust your strategies.
track actual results against your forecast predictions
analyze financial past, present, and future in one place

Analyze financial past, present, and future in one place

This holistic integration enables you to analyze your financial past, present, and future in one dashboard. All these insights help you make better strategic choices and plan for long-term success.
  • Access historical data to identify trends & performance benchmarks.
  • Monitor current financial health with real-time updates.
  • Forecast future performance based on reliable insights.

Identify trends & patterns to make smart decisions

Your data holds the answers to unlocking growth and efficiency. By identifying patterns and spotting opportunities, you can make smarter, data-backed decisions that move your business forward.
  • Analyze revenue trends to understand what drives success.
  • Detect inefficiencies and refine strategies to optimize performance.
  • Capitalize on emerging opportunities by making informed decisions.
identify trends & pattern to make smart decisions
make accurate financial reports without spreadsheets

Make accurate financial reports without spreadsheets

Creating accurate financial reports doesn’t have to be a tedious and error-prone task. Our automated reporting features ensure you get professional and accurate reports without relying on complex spreadsheets.
  • Automatically generate reports from real-time and accurate data.
  • Customize reports to align with business requirements.
  • Eliminate manual data entry errors and streamline the reporting process.
Turn your Xero data & forecasts into holistic financial reports
Get Early Access

Frequently Asked Questions

Integrating Xero with Forecastia is straightforward:

  • Go to the finance forecast module in Forecastia.
  • Select the "Actual" option and choose Xero Online as your accounting system.
  • Follow the prompts to sign in to your Xero account and authorize the connection.

Once done, Forecastia will sync your financial data for real-time analysis.
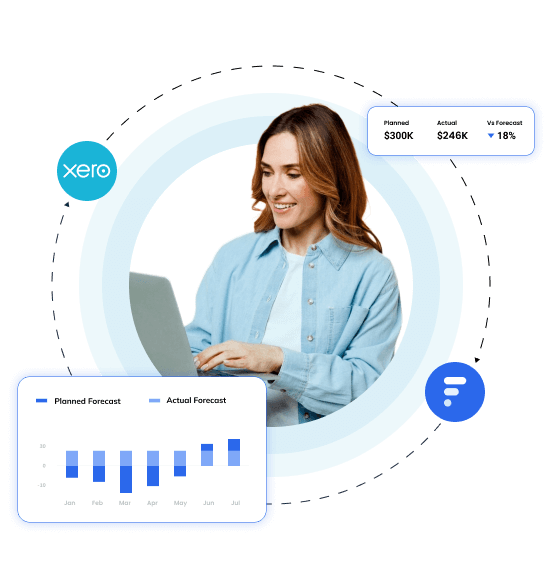
No, integrating Forecastia will not modify your Xero data. The synchronization is one-way; Forecastia only imports your existing data in real time and does not alter any data in Xero.
Your financial data is highly secure. Forecastia uses encryption and HTTPS protocols. Our servers are hosted on secure cloud platforms to ensure top-level security measures are maintained at all times.
Currently, Forecastia supports only Xero Online and doesn’t support Xero Desktop. We aim to provide a seamless experience to our users, but unfortunately, the Xero Desktop connection didn’t meet our reliability and ease-of-use standards, even after our best efforts.
Yes, you can use Forecastia even without Xero. Simply enter your financial data, and Forecastia will help you create detailed forecasts, budgets, and projections.
After integrating Xero with Forecastia, you can sync your Xero data in real time to update cash and profit forecasts. You’ll also get tools to compare actual vs planned metrics, along with detailed charts and graphs for better analysis and presentations.