
You’re about to pitch to a lender, and they ask for your balance sheet. But honestly, do you even know if it’s good news or bad? It turns out that many business owners aren’t sure either.
For many, it might seem like a pile of numbers that only an accountant would understand. But it’s equally important for you to know how to read a balance sheet.
Investors use it to see if you’re worth the risk, and lenders want to know if you’re reliable enough for a loan. If you can’t read it confidently, you could miss out on opportunities—or worse, walk straight into financial traps.
In this blog, we’ll show you how to read and understand a balance sheet in plain English without confusing jargon. But before we get into the nitty-gritty, let’s understand…
What is a balance sheet?
A balance sheet is one of the important financial documents that shows your company's financial position at a specific point in time. It details your assets (what your company owns), liabilities (what your company owes), and shareholders' equity (what’s actually yours).
The cash flow statement and the statement of retained earnings form the core of the three main financial statements every business needs. While the income statement shows if you’re making a profit, the balance sheet shows how your total assets are financed, through debt or equity.
To read a balance sheet, you’ll need to get familiar with some key terms.
Understand the necessary terminology
To understand a balance sheet, you must be familiar with some definitions: assets, liabilities, and owner’s equity. These ones follow the balance sheet formula:
Assets = Liabilities + Owners' Equity
We will consider a sample balance sheet example to understand the terminologies.
You're analyzing the Dec. 31, 2023, balance sheet of Greenline Inc., a medium-sized company that supplies eco-friendly containers and is applying for a loan to help the company grow twice as big. The lender wants to assess if the company’s finances are strong enough to handle more debt.
1) Assets
The assets section represents what a company (here, Greenline Inc.) owns and can use to generate value. They’re divided into two main types: Current and non-current assets.
Current assets: These are short-term resources that can be converted into cash within a year. For Greenline Inc., this includes:
- Cash and cash equivalents: $12,000 (money available for immediate use)
- Accounts receivable: $7,500 (money owed by customers)
- Inventory: $6,000 (unsold products ready for sale)
These assets give Greenline Inc. enough cash to cover short-term debts like bills and salaries.
Non-current assets: Long-term investments that finance business expansion but are not readily convertible to cash. For Greenline Inc., these are:
- Equipment and buildings: $30,000 (for production)
- Intangible assets patents: $4,000 (for new packaging technology)
- Goodwill: $2,500 (customer loyalty value and brand reputation)
Non-current assets reflect the funds invested by the company for long-term growth and stability.
In brief, assets are all that a company has and how those resources benefit the company.
2) Liabilities
Liabilities are those that Greenline Inc. owes to other people. They are company debts and are classified into current and non-current liabilities.
Current liabilities: These are obligations that must be paid within one year. For Greenline Inc., these include:
- Accounts payable: $5,000 (owing to suppliers)
- Short-term loan: $3,000 (credit taken to finance cash)
- Accrued expenses: $1,500 (unpaid salary and utility bills)
Efficiently managing liabilities paid ensures that the company doesn’t run into cash issues.
Non-current liabilities: These are the ones that can be paid off over more than a year, giving the company a bit more breathing room to handle them.. For Greenline Inc., this includes:
- Long-term loans: $12,000 (borrowed for new equipment)
- Deferred tax liabilities: $1,800 (taxes owed but not yet paid)
These liabilities help finance major investments without the immediate pressure of repayment.
Liabilities are about what a company owes and how well it manages its debts.
3) Owners’ equity
Owners’ equity (or shareholders' equity) is what’s left for the owners after paying off all liabilities. This account represents the net worth of the business and is a key indicator of financial health.
- Share capital: $15,000 (money invested by the owners).
- Retained earnings: $20,000 (profits reinvested into the business instead of paying out as dividends).
A strong balance sheet is especially important for a publicly traded company as investors use it to assess the company’s financial stability before buying shares.
In simple terms, owners’ equity shows what the owners truly own in Greenline Inc. after settling all debts.
| Breakdown of Greenline Inc’s balance sheet | |
|---|---|
| Assets | |
| Current | |
| Cash and cash equivalents | 12000 |
| Amounts receivable | 7500 |
| Inventory | 6000 |
| Total current assets | 25500 |
| Non-current | |
| Building, equipment, and raw materials | 30000 |
| Patents | 4000 |
| Goodwill | 2500 |
| Total non-current assets | 36500 |
| Total assets | 62000 |
| Liabilities | |
| Current liabilities | |
| Accounts payable | 5000 |
| Short-term bank loans | 3000 |
| Accrued expenses | 1500 |
| Total current liabilities | 9500 |
| Non current liabilities | |
| Long term bank loans | 12000 |
| Deferred tax liabilities | 1800 |
| Total non current liabilities | 13800 |
| Total liabilities | 23300 |
| Owner’s equity | |
| Shared capital | 15000 |
| Retained earnings | 20000 |
| Total equity | 35000 |
| Total liabilities and equity | 62000 |
What are some things to look for when reviewing a balance sheet?
Let us see how to review a balance sheet step by step.
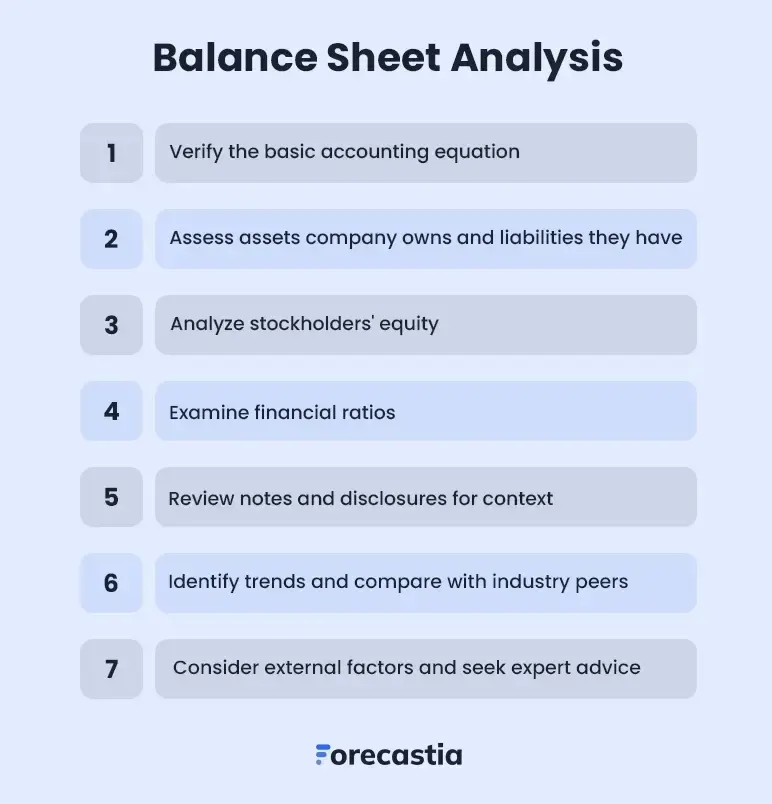
Step 1: Verify the basic accounting equation
Let’s start things off by making sure the company's balance sheet follows the golden rule of accounting.
Assets = Liabilities + Shareholders' equity
If it doesn’t balance, something’s off, maybe a missing prepaid expense or a mistake in reporting fixed assets. Fixing this is a must because it proves that every dollar of what the business owns is funded by either debt or shareholders' equity.
Without a balanced sheet, the rest of the financial statements won’t make much sense.
Step 2: Assess the assets the company owns and the liabilities they have
When you’re looking at assets, skip the long list of types and focus on how they actually affect the company's financial position. The goal is to see if the company's assets are balanced enough to cover the company's liabilities without stressing its cash flow.
If the proportion of assets to liabilities looks good, it shows your business’s ability to manage its financial obligations. For long-term assets, the key is to check if they’re pulling their weight by generating enough returns.
And when it comes to long-term liabilities like bonds payable, it’s all about figuring out if the company has a solid plan for paying them off without breaking the bank.
Occidental Petroleum did exactly this in 2024 by repaying $4 billion in debt in a single quarter, a move that boosted earnings and investor confidence.
Step 3: Analyze stockholders' equity
Owners' equity on the company's balance sheet is what’s left after all the debts are paid—basically, the owners’ share of the pie. It shows how much of the company's assets are funded by owner investments rather than debt.
The goal here is to watch the trends. If profits are getting reinvested, that’s a positive sign for growth. However, if the numbers on the balance sheet are negative, it could mean the company’s having a tough time managing its financial obligations. Spotting these patterns helps you figure out if the business is in good shape or if it’s time to dig deeper.
Step 4: Examine financial ratios
When you’re looking at a balance sheet, the financial ratios to care about are liquidity and solvency. The current ratio shows if the company can pay off its short-term bills comfortably.
Anything above 1 means the company isn’t likely to run out of cash anytime soon. The debt-to-equity ratio reveals whether the company is paying for its assets more with debt than with owner’s money.
A high number here is a bit of a red flag. Watching these ratios is a good way to spot whether the business is handling its money wisely or not.
Step 5: Review notes and disclosures for context
The notes and disclosures on the balance sheet might seem like extra reading, but they’re actually pretty useful. They break down stuff like accounting policies, any surprise financial obligations, and how total liabilities are being managed.
For instance, they might clarify if the company’s sitting on a pile of marketable securities for a good reason or just stalling on paying its bills. Ignoring these notes could leave you confused about the company’s financial condition. Spending a little time on them makes the whole balance sheet a lot clearer.
Step 6: Identify trends and compare with industry peers
Checking out balance sheets over a few reporting periods is a good way to spot patterns in assets, liabilities, and shareholders' equity. If you see steady growth in assets, it usually means the company’s on solid ground.
But if you see liabilities keep rising faster than net assets on the balance sheet, that’s a red flag. If you compare these numbers to what’s typical in the industry, it can tell you if the company’s a trendsetter or just struggling to keep up.
Starbucks, for example, actively monitors debt-to-equity and return on assets to guide its expansion strategies and benchmark against competitors. As of December 2024, it reported a return on assets (ROA) of 9.78% and a debt-to-equity ratio of -3.47. These figures indicate the company's focus on maintaining a balanced approach to leveraging debt and utilizing assets efficiently in its growth initiatives.
A higher current ratio in your balance sheet usually means better liquidity and a lower debt-to-equity ratio suggests a cautious approach to debt. This kind of review helps you get a real sense of the company’s financial health.
Step 7: Consider external factors and seek expert advice if needed to read financial statements
External factors like economic conditions and surprise regulations can throw a wrench into a company’s financial statements. For example, rising interest rates can make it way more expensive to pay off long-term debt, which isn’t exactly great for managing liabilities.
And let’s not forget that new rules can mean extra costs, which can throw off the balance between assets and liabilities. If you’re having a hard time making sense of the balance sheet, a quick call to a financial analyst could save you a lot of guesswork.
They can help you spot any red flags and give you a better idea of what’s really going on with the company’s finances.
Those are the steps you must follow to review a balance sheet.
Reading or maybe reviewing a balance sheet manually can take forever, and you might waste a lot of time trying to figure out the numbers every single time. Sure, it’s great if you know how to read one, but why not work smart by using AI instead to read a balance sheet?
Let AI read your balance sheet for you!
You don’t need to be a finance expert to understand your balance sheet—not when you’ve got AI to help. AI tools simplify complex financial data and give you clear, actionable insights. All you need to do is ask the right questions.
If you’re worried about your long-term liabilities, you can ask the AI, “Are my liabilities manageable based on my current assets?” or “How will these liabilities impact my cash flow?” AI tools will give you an answer and break down the numbers on your balance sheet in an easy-to-understand way.
But with so many AI tools out there, you need one that is efficient and doesn’t take forever to get results.
Forecastia, a financial forecasting software, makes reading a balance sheet simple. You can ask questions about anything—from your long-term liabilities to how your assets are performing—and get clear, easy-to-understand answers immediately. It also flags potential risks, like unpaid debts or a high debt-to-equity ratio, so you can catch issues on your balance sheet early.
In short, Forecastia makes reading your balance sheet a lot less stressful and a lot more actionable. If you want to get clear, practical insights without getting buried in numbers, Forecastia has got you covered.
Frequently Asked Questions
What are the key components of a balance sheet?
A typical balance sheet comprises three principal components: assets, liabilities, and shareholders' equity. These sections summarize the company's financial position at a certain reporting period. The balance sheet, together with the cash flow statement and other financial statements, assists in comprehending the overall economic value of the firm.
How often should a company review its balance sheet?
It makes sense to go through the balance sheet several times throughout the accounting year, at least quarterly. Frequent checks assist in evaluating how effectively the company keeps its liabilities and owners' equity in check.
How does a balance sheet differ from an income statement?
A balance sheet presents assets, liabilities, and shareholders' equity at a snapshot in time under the generally accepted accounting principles. In contrast, an income statement focuses on the company’s revenue, expenses, gains, and losses over an extended accounting period.
How can you analyze a balance sheet?
To analyze a balance sheet, check if assets equal liabilities and owners' equity—they must balance. Then, examine the proportion of intangible assets to total assets to understand how much of the company's value isn’t tied to physical items. Also, review how many liabilities are long-term and how much has been paid to gauge if the company can manage its debt.

Follow Vinay Kevadiya