
You’ve got the perfect blend of coffee, a cozy ambiance, and great customer service that would make anyone feel like royalty. But to keep it alive, you need a solid financial strategy that works.
From balancing your budget to deciding how much you should actually charge for every item on the menu, having a strong coffee shop financial plan can help you avoid the mistakes that cause many coffee shops to fail.
But how do you create one?
No worries! This guide will walk you through how to create a financial plan that ensures your coffee shop thrives for years to come.
Let’s dive in!
How do you build coffee shop financial projections?
Creating realistic financial projections for your coffee shop involves thorough analysis and meticulous planning to comprehend its financial health and growth potential.
Here’s a step-by-step guide to help you build accurate and actionable projections while ensuring you factor in every detail:
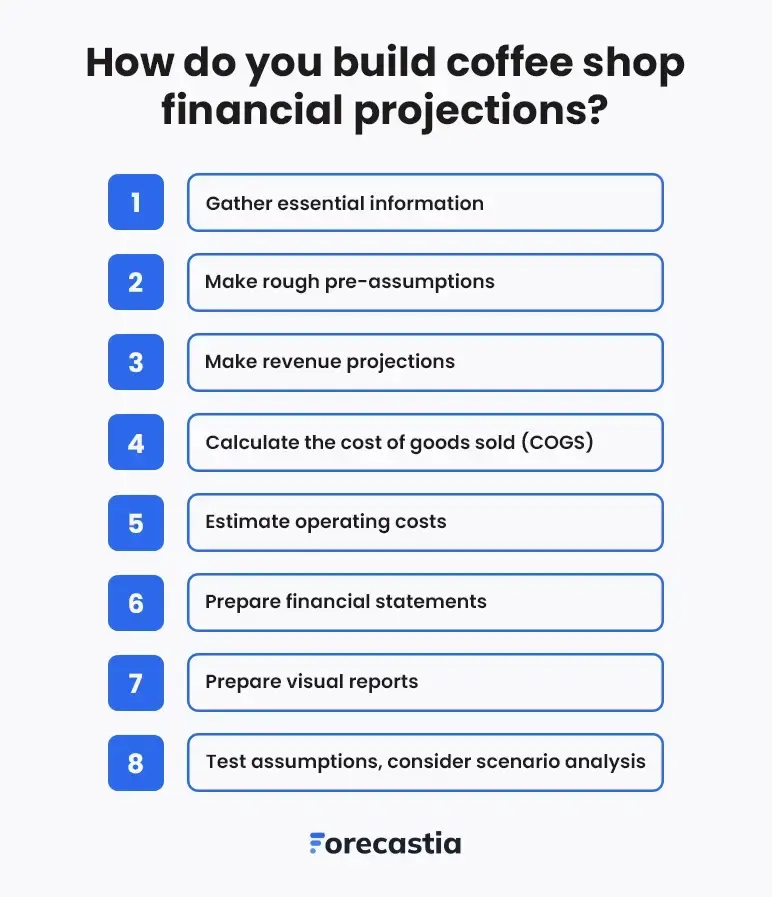
1. Gather essential information
First, collect all the relevant key data that lays the groundwork for accurate financial projections.
This would include your coffee shop details like:
- Current operations
- Target demographics
- Historical financial performance
- And industry benchmarks.
Start with your sales data—look at daily and weekly revenue trends, identify peak sales times (such as morning rush hours or weekends), and analyze how they change with seasons.
For new coffee shops, analyze the latest market trends, industry benchmarks, and local competitors to make educated estimates.
Further, understand your customers inside out.
- Who are they?
- What do they like?
- What are their spending habits and visit patterns?
Then, track inventory data—monitor stock levels, turnover rates, and supplier costs to ensure precise cost calculations.
Most importantly, don’t forget to analyze the past performance data of your coffee shop to understand what drives your business.
Consider analyzing previous revenues, costs, and profits to detect trends and highlight the areas for improvement. Analyze how some of the marketing campaigns, new menu items, or seasonal changes impacted your sales and cost.
That’s how you'll have everything you need to create accurate and actionable financial projections.
2. Make rough pre-assumptions
Now, make some preliminary assumptions for your coffee shop’s financial projections based on gathered data. Such estimates will outline your business's revenues, expenses, and profitability levels.
Start by focusing on the basics: How much you’ll make in monthly sales, how much customers will spend on average, and what your operating costs might look like.
Use the understanding of past sales trends, industry benchmarks, and your own research. Even, take into account factors like seasonal changes or upcoming menu additions that could affect your numbers.
Here are a few key metrics to consider while making your assumptions:
- Revenue growth: Predict a percentage increase in sales, such as a 5% annual growth based on an expanding customer base or marketing efforts.
- Cost increases: Account for potential rises in ingredient (coffee bean prices, milk, or syrups) prices or wage adjustments, such as a 10% increase in utilities during summer.
- Seasonality: Factor in sales spikes during holidays like Christmas with festive drink offerings or slow months like January when post-holiday spending declines.
- Economic conditions: Account for inflation, rising wages, or other economic factors that may impact both costs and customer spending power.
Don’t aim for perfection—these are rough estimates to guide your planning that will evolve over time. So, revisit them periodically as actual data comes in.
3. Make revenue projections
Revenue projections are all about figuring out how much money your coffee shop might make.
To get started, think about a few simple things: What is the average number of customers coming to your coffee shop per day, how often do they turn over, and how much do they usually spend.
Breaking it down step-by-step makes it easier to see your earning potential.
If your coffee shop serves 40 customers daily. An average turnover of 3 times per day, and customers spend around $6 each, here’s the math:
40 seats × 3 turnovers × $6 × 30 days = $21,600/month
But, you’ll also need to consider things like holidays, weekends, or special events, which can bring in more customers and boost your coffee shop’s revenue further. On the other hand, slower months or quieter weekdays might drive less income.
Additionally, account for other ways to make money. Offering services like catering, delivery, selling coffee beans or branded merchandise, or hosting events can significantly boost your overall income.
By including these extra streams, you’ll get a more accurate picture of what your coffee shop can earn.
Revenue projections aren’t merely a dry exercise of crunching numbers—they set realistic expectations while preparing for both the busy times and the quieter ones.
4. Calculate the Cost of Goods Sold (COGS)
The next step is to calculate your Cost of Goods Sold (COGS)—basically, the direct costs of making the coffee, drinks, and food you sell. This would include everything that goes into creating your products, from ingredients to packaging.
Here's an easy way to do your COGS calculation:
List your ingredients: Note down every component you need to make your menu items—coffee beans, milk, syrups, pastries, tea bags, and even things like cups and napkins.
Find the costs: Scan your invoices or receipts to figure out how much you’re paying for each item.
Calculate per item: Determine how much it costs to make each item on your menu (i.e. if it costs you $1.50 to make one latte with $0.50 for the coffee beans, $0.30 for the milk, $0.20 for the syrup, and $0.50 for the cup. If you sell 1,000 lattes, your COGS for lattes is $1,500).
Add it all up: Total up the cost for all your menu items and get your monthly COGS.
For example, if you spend $10,000 a month on ingredients and supplies to generate $30,000 in revenue, your COGS is $10,000.
Knowing your COGS will help you manage expenses, optimize resources, and boost profits.
5. Estimate operating costs
Next, describe the expected expenses incurred to operate your coffee shop.
When assessing the business operational costs, first list the fixed costs that would remain the same month in and out, including rent, insurance, and salaries, and loan payments.
Then, you have to identify variable costs that vary over time. It includes utilities, supplies, part-time wages or marketing expenses.
Lastly, sum up the fixed and variable costs to come up with your total operating costs.
Overall, by calculating your operating costs, you can manage your budget and know whether your revenues can cover all the expenses to leave room for profit.
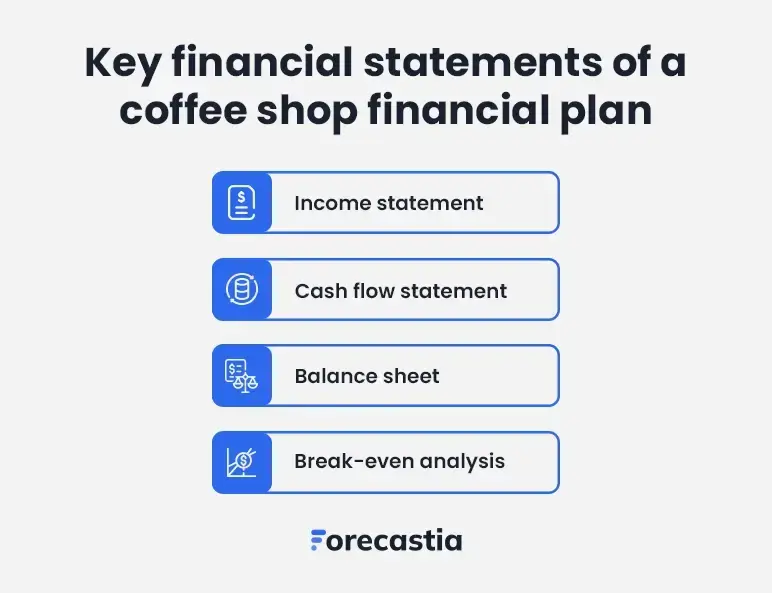
6. Prepare financial statements
After estimating your coffee shop's revenue, COGS, and operating expenses, it’s time to draft clear financial statements. These documents are essential for illustrating your coffee shop’s financial health and growth potential to prospective investors.
Here are the critical financial statements and reports that you should consider including in your plan:
- Income statement (profit and loss statement)
- Cash flow statement
- Balance sheet
- Break-even analysis
By adding these financial statements, you showcase your financial standing to potential investors so they can make well-informed decisions regarding investment.
We'll explore each of these financial components in greater detail in the upcoming sections, giving you insights needed to create a strong financial plan.
7. Prepare visual reports
Numbers alone aren't enough. Present your coffee shop’s finances in a visually appealing and easily digestible format that readers can quickly understand and get valuable insights.
Using charts and graphs makes it easier to highlight your coffee shop’s key aspects, including revenue trends, expenses, profit margins, and cash flow.
Don’t worry; it’s easy. Use simple bar charts, pie charts, and line graphs to make the data clear. Also, highlight patterns like seasonal sales changes or rising costs to help with planning.
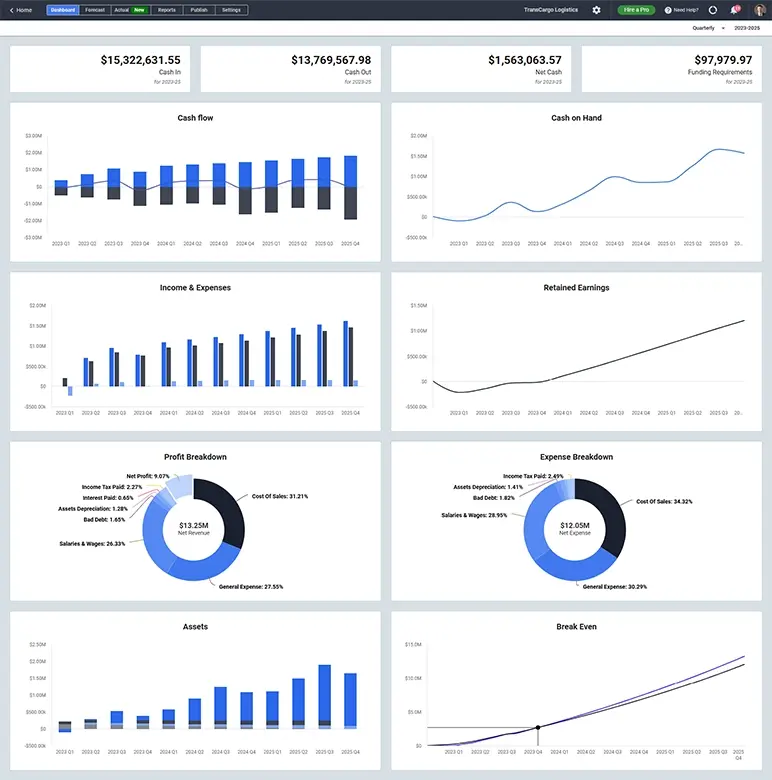
This will not only help analyze financial data but also enable you to communicate key metrics effectively to your team as well as investors.
8. Test assumptions, consider scenario analysis
Finally, take a step back and test the numbers to ensure your projections are more accurate. Try to run different scenarios (best- and worst-case) to see how changes impact your financial outcomes.
For instance, analyze what happens if ingredient costs (like coffee beans or milk) increase by 15% or customer traffic drops during slower months or on weekdays.
Considering these “what-if” situations helps you identify potential problems in business operations and come up with solutions in advance. It even increases transparency and lets investors better understand your coffee shop’s future with different scenarios.
Overall, these test assumptions and sensitivity analysis will help you make strategic decisions and necessary adjustments to keep your coffee shop running smoothly.
Key financial statements of a coffee shop financial plan
A detailed coffee shop financial plan typically includes important financial documents like the income statement, cash flow statement, balance sheet, and break-even analysis.
These reports clearly describe your coffee shop's current monetary position and the overall financial strategy to achieve future goals.
Let's explore each statement in detail.
1. Income statement
The income statement is also known as the profit and loss statement. It gives you a solid understanding of your coffee shop’s revenue, expenses, gross margin, and net profit for a specific time.
It helps you see whether your business is making enough money to cover its costs and turn a profit.
The gross profit is what you get after subtracting the COGS from the total revenue. This shows how efficiently your coffee shop uses its resources.
Further, divide the gross profit by revenue and convert it into a percentage to determine the gross margin.
Then, reduce operating costs like rent, staff salary, and utility to get the EBITDA. Finally, subtract interest, taxes, depreciation, and amortization from the EBITDA to arrive at the net profit of your coffee shop—the figure that investors care about the most.
Here’s an example of a traditional brick-and-mortar coffee shop’s income statement to demonstrate these calculations:
| Description | Amount ($) |
|---|---|
| Total Revenue | 205,000 |
| - Coffee Sales | 150,000 |
| - Pastries and Snacks | 45,000 |
| - Merchandise (coffee beans, mugs, etc.) | 10,000 |
| Cost of Goods Sold (COGS) | 64,000 |
| - Coffee Ingredients | 45,000 |
| - Pastry Ingredients | 15,000 |
| - Merchandise COGS | 4,000 |
| Gross Profit | 141,000 |
| Operating Expenses | 19,000 |
| - Rent | 3,000 |
| - Salaries | 12,000 |
| - Utilities | 1,000 |
| - Marketing | 2,000 |
| - Supplies and Miscellaneous | 1,000 |
| EBITDA (Earnings Before Interest, Taxes, Depreciation, and Amortization) | 122,000 |
| - Depreciation & Amortization | 2,500 |
| - Depreciation | 2,000 |
| - Amortization | 500 |
| Operating Income | 119,500 |
| Interest Expense | 1,500 |
| Net Income Before Taxes | 118,500 |
| Taxes (30%) | 35,550 |
| Net Income (After Taxes) | 82,950 |
The coffee shop generates $205,000 in revenue each month, with $150,000 coming from coffee sales, $45,000 from pastries and snacks, and $10,000 from merchandise like coffee beans and branded mugs.
Each month, it incurs $64,000 in Cost of Goods Sold (COGS), which includes $45,000 for coffee ingredients, $15,000 for pastries, and $4,000 for merchandise-related costs.
After covering these costs, the shop is left with a gross profit of $141,000. Operating expenses, including rent, salaries, and utilities, are $19,000, resulting in an EBITDA of $122,000.
After $2,500 for depreciation and $1,000 in interest, the net income before taxes is $118,500. The net income is $82,950 after 30% taxes.
This income statement helps identify areas to adjust if costs rise or traffic drops, ensuring the shop stays profitable.
In simple terms, the income statement tells you if your coffee shop is making money and staying financially healthy over time.
2. Cash flow statement
A cash flow statement shows how money is coming in and going out of your coffee shop over a certain period. It helps you figure out if you have enough cash to cover your daily expenses.
It’s also great for spotting potential cash shortages, especially during slower months, and demonstrates how much cash is coming from operations compared to things like investments or loans.
To create one, you’ll need to include cash from sales, costs for ingredients and supplies, and other overhead expenses. It highlights how much money your coffee shop is making and spending during that period.
| Description | Amount ($) |
|---|---|
| Cash Inflows from Operations | |
| - Coffee Sales | 150,000 |
| - Pastries & Snacks | 45,000 |
| - Merchandise (e.g., coffee beans, mugs) | 10,000 |
| Total Cash Inflows from Operations | 205,000 |
| Cash Outflows for Operations | |
| - Coffee Ingredients | 45,000 |
| - Pastry Ingredients | 15,000 |
| - Merchandise Costs | 4,000 |
| - Rent | 3,000 |
| - Salaries | 12,000 |
| - Utilities | 1,000 |
| - Marketing | 2,000 |
| - Supplies & Miscellaneous | 1,000 |
| Total Cash Outflows from Operations | 83,000 |
| Net Cash from Operating Activities | 122,000 |
| Investing Activities | |
| - Equipment Purchase | 5,000 |
| Total Cash Outflows from Investing | 5,000 |
| Net Cash from Investing Activities | -5,000 |
| - Cash from Loan Received | 10,000 |
| - Cash for Loan Repayment | 2,000 |
| Net Cash from Financing Activities | 8,000 |
| Net Increase in Cash | 125,000 |
| Cash at Beginning of Period | 30,000 |
| Cash at End of Period | 155,000 |
That said, it’s a good illustration of how well your business is at generating cash. The precision of your projections in these aspects directly impacts the reliability of your cash flow.
So, be realistic with the assumptions you make in the cash flow statement. Use industry standards and consider market situations to ensure accuracy.
3. Balance sheet
A balance sheet gives a quick snapshot of your coffee shop’s financial position for a specific timeframe. It shows what the coffee shop owns, what it owes to others, and what’s left for you.
After all, it covers these key elements:
- Assets: Cash at hand, accounts receivable and inventory, equipment.
- Liabilities: Financial obligations like short-term debts and long-term loans.
- Equity: The leftover earnings once liabilities are subtracted from assets.
Ideally, it’s presented as, Assets = Liabilities + Equity.
| Description | Amount ($) |
|---|---|
| Assets | |
| Current Assets | |
| - Cash | 155,000 |
| - Accounts Receivable | 5,000 |
| - Inventory (coffee, pastries, supplies) | 10,000 |
| Total Current Assets | 170,000 |
| Non-Current Assets | |
| - Equipment (espresso machines, grinders) | 30,000 |
| - Leasehold Improvements | 15,000 |
| Total Non-Current Assets | 45,000 |
| Total Assets | 215,000 |
| Liabilities | |
| Current Liabilities | |
| - Accounts Payable (suppliers, bills) | 10,000 |
| - Short-term Loan | 5,000 |
| Total Current Liabilities | 15,000 |
| Non-Current Liabilities | |
| - Long-term Loan | 20,000 |
| Total Non-Current Liabilities | 20,000 |
| Total Liabilities | 35,000 |
| Equity | |
| - Owner’s Equity (Initial Investment) | 150,000 |
| - Retained Earnings (Profit from Operations) | 30,000 |
| Total Equity | 180,000 |
| Total Liabilities & Equity | 215,000 |
Investors really pay close attention to the balance sheet because it shows them your coffee shop’s financial structure, return on investment (ROI), and overall stability.
It also provides an idea of the cash that is available to you, how the money is blocked, and what kind of solid business you are running.
4. Break-even analysis
We all know that profit is the all-time motive of all coffee shop owners. The real question is: When does the money actually start coming in?
A break-even analysis fits the bill at this stage. It shows exactly how much you’ll need to generate in revenue for all the costs to be recovered—no profit and no loss; just breaking even.
Let's take an example to see how it works.
For a cafeteria-style coffee shop:
Fixed costs: $18,000 (including rent: $8,000, utilities: $2,000, wages: $6,000, insurance: $1,000)
Variable costs: $24,000 (ingredients like coffee beans, milk, syrups, cups, pastries)
Revenue: $75,000
Contribution Margin: ($75,000 - $24,000) ÷ $75,000 = 0.68%
Break-even sales calculation: $18,000 ÷ 0.68 = $26,471
So, this coffee shop needs to bring in at least $26,471 in sales each month to cover all its costs and break even.
This analysis shows exactly how much revenue is needed to reach the point where your total sales just cover your costs, causing no profit or loss.
In addition, this will give potential investors or lenders a fair idea of when your coffee shop would be profitable.
Download free coffee shop financial projections example
Creating a coffee shop financial plan from scratch seems overwhelming. After all, Excel sheets are tiring and endlessly long. But no worries! We’re here to help you with our free coffee shop financial plan sample.
It covers all the key components of a coffee shop's financial projection, such as sales forecast, P&L or income statement, balance sheet, cash flows, and break-even analysis, simplifying the entire financial planning process to help you get started.
Build accurate financial projections using Forecastia
That’s it! We’ve discussed almost everything about creating coffee shop financial projections in this guide. Now, it should be much easier for you to put that knowledge into action and start planning.
But if it still feels like a lot to handle, don’t worry; Forecastia is the only AI-powered financial forecasting tool you need to make the process simple and stress-free.
It’s specifically designed for businesses looking to build accurate financial projections, anticipate future cash flows, and analyze overall financial performance—all without using spreadsheets!
Frequently Asked Questions
What are the key financial statements in a coffee shop financial plan?
A detailed financial plan for a coffee shop must include the following key financial statements:
- Income statement (Profit and loss statement)
- Balance sheet
- Cash flow statement
- Break-even analysis
How do I create financial projections for my café?
Follow these steps to create financial projections for your café:
- Estimate revenue projections
- Calculate Cost of Goods Sold (COGS)
- Factor in operating expenses
- Determine capital expenses & depreciation
- Project your break-even point
- Forecast profits & cash flow
What are common operating expenses in a coffee shop financial plan?
The most common operating expenses to include in a coffee shop financial plan are rent or lease, utilities, wages, the cost of goods sold, marketing, insurance, equipment maintenance, and more. Knowing these costs helps you in budgeting and estimating how much revenue needs to be generated to reach profitability.
How to use the coffee shop financial projections template?
Fill in your café details, like your projected sales, COGS, and ongoing expenses in the coffee shop financial plan template. It often comes with built-in formulas that help you calculate key metrics like gross profit, cash flow, and break-even point, giving you a clear view of your café's financial health.
How often should I update my coffee shop’s financial projections?
It's recommended to review and update your coffee shop financial plan at least once a year. This will ensure your initial goals and projections remain accurate and aligned with your business’s growth.

Follow Vinay Kevadiya