
Running a SaaS business is exciting—you build, scale, and solve real problems with technology. And the market is booming, projected to hit $908.21 billion by 2030.
But while revenue can scale quickly, so can costs. Server expenses, software development, and marketing can eat into profits if you're not careful.
That’s why a solid financial plan is just as important as great software. It helps you manage costs, price your product right, and keep cash flow steady while growing profits.
Not sure how to build one? No worries. This guide breaks it all down—simple, practical, and made for SaaS founders like you.
How do you build SaaS financial projections?
Creating realistic financial projections for your SaaS business involves thorough analysis and meticulous planning to comprehend its financial health and growth potential.
Here’s a step-by-step guide to help you build accurate and actionable projections while ensuring you factor in every detail:
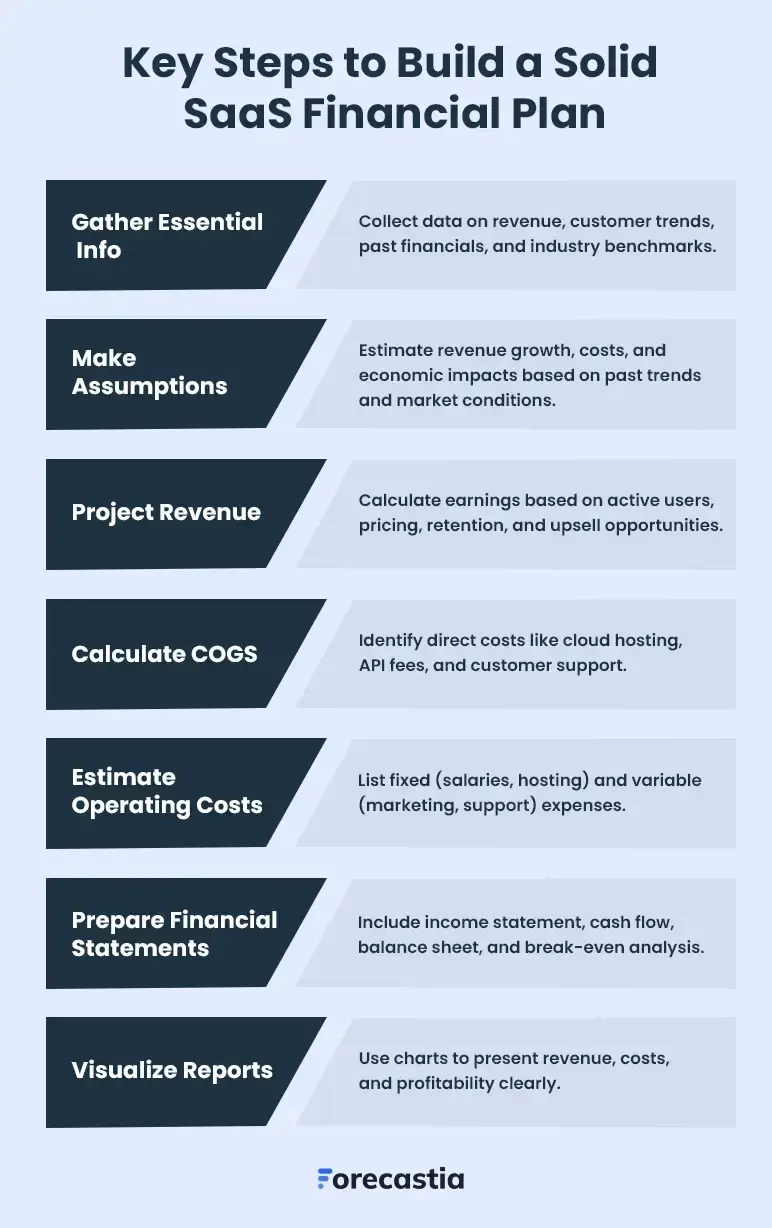
1. Gather essential information
First, collect all the relevant key data that lays the groundwork for accurate financial projections.
This would include SaaS details like:
- Current operations
- Target demographics
- Historical financial performance
- And industry benchmarks.
Start with your revenue data—analyze monthly recurring revenue (MRR), customer acquisition trends, churn rates, and how they fluctuate over time or with market changes.
For a new SaaS business, analyze the latest market trends, industry benchmarks, and local competitors to make educated estimates.
Further, understand your customers inside out.
- Who are they?
- What problems does your SaaS solve for them?
- What features do they use the most?
Most importantly, don’t forget to evaluate the past performance data of your SaaS to understand what drives your business.
Consider analyzing previous revenues, costs, and profits to detect trends and highlight the areas for improvement. Check how your marketing campaigns, feature launches, or pricing changes impacted your revenue, churn rate, and customer acquisition costs (CAC).
That’s how you'll have everything you need to create accurate and actionable financial projections.
2. Make rough pre-assumptions
Now, make some preliminary assumptions for your SaaS’s financial projections based on gathered data. Such estimates will outline your business's revenues, expenses, and profitability levels.
Start by focusing on the basics: How much you’ll make in monthly sales, how much customers will spend on average, and what your operating costs might look like.
Use the understanding of past sales trends, industry benchmarks, and your own research. Also, consider factors like market trends, upcoming feature releases, or seasonal demand shifts that could impact your revenue and expenses.
Here are a few key metrics to consider while making your assumptions:
- Revenue growth: Predict a percentage increase in sales, such as a 5% annual growth based on an expanding customer base or marketing efforts.
- Increasing costs: Include increasing server expense, software development costs, or wage rates, like a 15% rise in infrastructure expense as user demand increases.
- Seasonality: Factor in variations of subscription renewals, churn periods, or slower engagement times, such as summer doldrums or year-end budget crunches impacting B2B customers.
- Economic conditions: Account for inflation, rising wages, or other economic factors that may impact both costs and customer spending power.
Don’t aim for perfection—these are rough estimates to guide your planning that will evolve over time. So, revisit them periodically as actual data comes in.
3. Make revenue projections
Revenue projections are all about figuring out how much money your SaaS might make.
To get started, think about a few key metrics: How many active users you have, how often they renew or churn, and the average revenue per user (ARPU).
Breaking it down step-by-step makes it easier to see your earning potential.
If you have 1,000 subscribers, an average subscription price of $50, and a 90% retention rate:
1,000 users × $50 × 90% retention = $45,000 MRR
But, you’ll also need to consider factors like annual billing cycles, promotional discounts, or industry trends—they can increase customer sign-ups and boost your revenue. On the other hand, churn spikes or slower adoption periods might reduce income.
Additionally, explore other revenue streams. Upselling premium plans, add-ons, integrations, or white-label solutions can significantly increase your overall revenue.
By including these extra streams, you’ll get a more accurate picture of what your SaaS company can earn.
Revenue projections aren’t merely a dry exercise of crunching numbers—they set realistic expectations while preparing for both the busy times and the quieter ones.
4. Calculate the Cost of Goods Sold (COGS)
The next step is to calculate your Cost of Goods Sold (COGS)—essentially, the direct costs of delivering your SaaS product. This includes server costs, third-party API fees, cloud storage, and customer support expenses directly tied to providing your service.
Here's an easy way to do your COGS calculation:
List the direct costs: Identify all the direct expenses tied to delivering your SaaS product, such as server costs, third-party API fees, cloud hosting, and customer support for active users.
Find the costs: Review invoices from cloud providers, software tools, and other service providers to determine monthly expenses.
Calculate per user: Determine how much it costs to serve each customer. For example, if your cloud infrastructure costs $5 per user and you have 1,000 users, your COGS for that service is $5,000.
Add it up: Sum all direct costs to calculate your total monthly COGS.
For example, if your SaaS company spends $15,000 per month on hosting, APIs, and support to generate $75,000 in revenue, your COGS is $15,000.
5. Estimate operating costs
Next, describe the expected expenses incurred to operate your SaaS business.
When assessing SaaS operational costs, start by listing fixed costs—expenses that stay consistent each month, such as software development salaries, cloud hosting subscriptions, and business insurance.
Next, identify variable costs—expenses that fluctuate over time, including customer support costs, marketing spend, payment processing fees, and server scaling based on user demand.
Lastly, sum up the fixed and variable costs to come up with your total operating costs.
Overall, by calculating your operating costs, you can manage your budget and know whether your revenues can cover all the expenses to leave room for profit.
6. Prepare financial statements
After estimating your SaaS company's revenue, COGS, and operating expenses, it’s time to draft clear financial statements. These documents are essential for illustrating your SaaS financial health and growth potential to prospective investors.
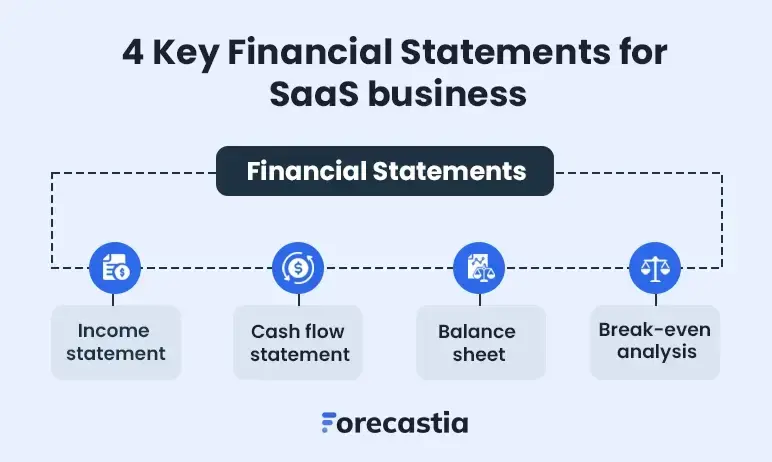
Here are the critical financial statements and reports that you should consider including in your plan:
- Income statement (profit and loss statement)
- Cash flow statement
- Balance sheet
- Break-even analysis
By adding these financial statements, you showcase your financial standing to potential investors so they can make well-informed decisions regarding investment.
We'll explore each of these financial components in greater detail in the upcoming sections, giving you insights needed to create a strong financial plan.
7. Prepare visual reports
Numbers alone aren't enough. Present your SaaS business’s financial data in a visually appealing and easily digestible format that readers can quickly understand and get valuable insights.
Using charts and graphs makes it easier to highlight your SaaS company's key aspects, including revenue trends, expenses, profit margins, and cash flow.
Don’t worry; it’s easy. Use simple bar charts, pie charts, and line graphs to make the data clear. Also, highlight patterns like seasonal sales changes or rising costs to help with planning.
This will not only help analyze financial data but also enable you to communicate key metrics effectively to your team as well as investors.
8. Test assumptions, consider scenario analysis
Finally, take a step back and test the numbers to ensure your projections are more accurate. Try to run different scenarios (best- and worst-case) to see how changes impact your financial outcomes.
For instance, analyze what happens if cloud hosting costs increase by 15% or churn rates rise during slower months, impacting monthly recurring revenue (MRR) and profitability.
Considering these “what-if” situations helps you identify potential problems in business operations and come up with solutions in advance. It even increases transparency and lets investors better understand your SaaS firm’s future with different scenarios.
Overall, these test assumptions and sensitivity analysis will help you make strategic decisions and necessary adjustments to keep your SaaS business running smoothly.
Key financial statements of a SaaS financial plan
A detailed SaaS financial plan typically includes important financial documents like the income statement, cash flow statement, balance sheet, and break-even analysis.
These reports clearly describe your SaaS company's current monetary position and the overall financial strategy to achieve future goals.
Let's explore each statement in detail.
1. Income statement
The income statement is also known as the profit and loss statement. It gives you a solid understanding of your SaaS business’s revenue, expenses, gross margin, and net profit for a specific time.
It helps you see whether your business is making enough money to cover its costs and turn a profit.
The gross profit is what you get after subtracting the COGS from the total revenue. This shows how efficiently your SaaS company uses its resources.
Further, divide the gross profit by revenue and convert it into a percentage to determine the gross margin.
Then, reduce operating costs like server expenses, salaries, and marketing costs to calculate EBITDA (Earnings Before Interest, Taxes, Depreciation, and Amortization).
Finally, subtract interest, taxes, depreciation, and amortization from EBITDA to determine your net profit. EBITDA to arrive at the net profit of your SaaS product—the figure that investors care about the most.
Here’s an example of a mid-sized SaaS company’s income statement to demonstrate these calculations:
| Category | Amount ($) |
|---|---|
| Revenue | |
| Subscription Revenue | $2,000,000 |
| Enterprise Licensing Revenue | $500,000 |
| Professional Services Revenue | $250,000 |
| Total Revenue | $2,750,000 |
| Cost of Goods Sold (COGS) | |
| Server & Hosting Costs | $250,000 |
| Software Licensing & API Costs | $100,000 |
| Customer Support Expenses | $150,000 |
| Total COGS | $500,000 |
| Gross Profit | $2,250,000 |
| Operating Expenses | |
| Sales & Marketing | $600,000 |
| Research & Development | $450,000 |
| General & Admin (G&A) | $300,000 |
| Employee Salaries & Benefits | $500,000 |
| Total Operating Expenses | $1,850,000 |
| Operating Profit (EBIT) | $400,000 |
| Other Income & Expenses | |
| Interest Income | $10,000 |
| Loan Interest Expense | ($25,000) |
| Taxes (20%) | ($75,000) |
| Net Profit | $310,000 |
This SaaS company got $2,750,000 in revenue. Since software businesses typically have high margins, their COGS was just $500,000, and gross profit of $2,250,000.
But running the business isn’t cheap. They spent:
- $600,000 on sales & marketing
- $450,000 on R&D
- $500,000 on wages
That adds up to $1,850,00 in operating costs, bringing their operating profit to $400,000.
On top of that, they earned $10K in interest income, but also had to pay:
- $25,000 in loan interest
- $75,000 in taxes
After all expenses, the net profit lands at $310,000, giving them a net margin of 11.3%. Not bad for a SaaS business!
In simple terms, the income statement tells you if your SaaS is making money and staying financially healthy over time.
2. Cash flow statement
A cash flow statement shows how money is coming in and going out of your SaaS business over a certain period. It helps you figure out if you have enough cash to cover your daily expenses.
It’s also great for spotting potential cash shortages, especially during slower months, and demonstrates how much cash is coming from operations compared to things like investments or loans.
To create one, you’ll need to include cash from subscriptions, costs like server expenses and third-party API fees, and other overhead expenses. It highlights how much money your SaaS business is generating and spending during that period.
Your SaaS cash flow statement tracks how money moves in and out. Here’s a quick example:
Example: Monthly SaaS Cash Flow
Cash In (Revenue)
- Subscriptions: $100,000
- Enterprise Licensing: $20,000
- Total Cash In: $120,000
Cash Out (Expenses)
- Server & Hosting Costs: $15,000
- API Fees: $5,000
- Customer Support Salaries: $25,000
- Marketing & Ads: $20,000
- Total Cash Out: $65,000
Net Cash Flow: $55,000 (Positive)
What this means
- You’re generating more cash than you’re spending.
- If subscriptions drop, your cash flow could be impacted.
- Having a surplus helps you reinvest or prepare for slower months.
That said, it’s a good illustration of how well your business is at generating cash. The precision of your projections in these aspects directly impacts the reliability of your cash flow.
So, be realistic with the assumptions you make in the cash flow statement. Use industry standards and consider market situations to ensure accuracy.
3. Balance sheet
A balance sheet gives a quick snapshot of your SaaS company’s financial position for a specific timeframe. It shows what the SaaS business owns, what it owes to others, and what’s left for you.
After all, it covers these key elements:
- Assets: Cash at hand, accounts receivable, the actual SaaS product, intellectual property, office equipment.
- Liabilities: Financial obligations like short-term debts and long-term loans.
- Equity: The leftover earnings once liabilities are subtracted from assets.
Ideally, it’s presented as, Assets = Liabilities + Equity.
| Category | Amount ($) |
|---|---|
| Assets | |
| Current Assets | |
| Cash & Cash Equivalents | $745,000 |
| Accounts Receivable | $120,000 |
| Prepaid Expenses | $30,000 |
| Total Current Assets | $895,000 |
| Non-Current Assets | |
| Property, Equipment & Servers | $250,000 |
| Software Development Costs | $400,000 |
| Intangible Assets (Patents, Licenses) | $150,000 |
| Total Non-Current Assets | $800,000 |
| Total Assets | $1,695,000 |
| Liabilities & Equity | |
| Current Liabilities | |
| Accounts Payable | $75,000 |
| Deferred Revenue | $100,000 |
| Short-term Debt | $50,000 |
| Total Current Liabilities | $225,000 |
| Non-Current Liabilities | |
| Long-term Debt | $250,000 |
| Total Liabilities | $475,000 |
| Equity | |
| Common Stock | $500,000 |
| Retained Earnings | $720,000 |
| Total Equity | $1,220,000 |
| Total Liabilities & Equity | $1,695,000 |
This balance sheet shows a healthy liquidity position and solid equity base, positioning the company well for future growth.
Investors really pay close attention to the balance sheet because it shows them your SaaS company’s financial structure, return on investment (ROI), and overall stability.
It also provides an idea of the cash that is available to you, how the money is blocked, and what kind of solid business you are running.
4. Break-even analysis
We all know that profit is the all-time motive of all SaaS business owners. The real question is: When does the money actually start coming in?
A break-even analysis fits the bill at this stage. It shows exactly how much you’ll need to generate in revenue for all the costs to be recovered—no profit and no loss; just breaking even.
Let's take an example to see how it works.
For a SaaS business:
- Fixed costs: $20,000 (including cloud hosting: $7,000, developer salaries: $10,000, and software licenses: $3,000)
- Variable costs: $15,000 (customer support, payment processing fees)
- Revenue: $60,000
- Contribution Margin: ($60,000 - $15,000) ÷ $60,000 = 0.75 (or 75%)
- Break-even sales calculation: $20,000 ÷ 0.75 = $26,667
So, this SaaS business needs to generate at least $26,667 per month to cover all costs and break even.
This analysis shows exactly how much revenue is needed to reach the point where your total sales just cover your costs, causing no profit or loss.
In addition, this will give potential investors or lenders a fair idea of when your SaaS would be profitable.
Download free SaaS financial projections example
Creating a SaaS financial plan from scratch seems overwhelming. After all, Excel sheets are tiring and endlessly long. But no worries! We’re here to help you with our free SaaS financial plan sample.
It covers all the key components of a SaaS's financial projection, such as sales forecast, P&L or income statement, balance sheet, cash flows, and break-even analysis, simplifying the entire financial planning process to help you get started.
Build accurate financial projections using Forecastia
That’s it! We’ve discussed almost everything about creating SaaS financial projections in this guide. Now, it should be much easier for you to put that knowledge into action and start planning.
But if it still feels like a lot to handle, don’t worry; Forecastia is the only AI-powered financial forecasting tool you need to make the process simple and stress-free.
It’s specifically designed for businesses looking to build accurate financial projections, anticipate future cash flows, and analyze overall financial performance—all without using spreadsheets!
Frequently Asked Questions
What are the key financial statements in a SaaS financial plan?
A SaaS financial plan includes three main financial statements:
- Income statement
- Cash flow statement
- Balance sheet
These statements help in understanding profitability, cash flow, and financial stability.
How often should I update my SaaS’s financial projections?
Update at least quarterly, or whenever:
- You launch new pricing or products.
- Market conditions change.
- You secure funding or investors request updates.
- Customer churn or acquisition trends shift.
How do I create financial projections for my SaaS?
Follow these steps:
- Revenue forecasting – Estimate user growth, pricing models, and churn rates.
- COGS calculation – Include hosting, support, and software costs.
- Operating expenses – Account for sales, marketing, and development costs.
- Cash flow projections – Track funding, expenses, and cash runway.
- Profitability analysis – Project net profit and break-even point.
Use historical data and industry trends to improve accuracy.
What are common operating expenses in a SaaS financial plan?
Typical SaaS operating expenses include:
- Sales & marketing
- Research & Development (R&D)
- Customer support
- Hosting & Infrastructure
- General & Admin (G&A)
These costs impact profitability and growth potential.
How to use the SaaS financial projections template?
A financial projections template makes planning easier by breaking it down step by step:
- Fill in revenue estimates based on subscriptions, upsells, and churn.
- Add expenses for hosting, development, and customer support.
- Adjust projections based on user growth, market trends, and financial goals.
- Review cash flow to plan for runway and funding needs.
Keeping your projections up to date ensures your SaaS business stays profitable and scalable.

Follow Vinay Kevadiya