
The construction industry is growing fast and is projected to reach a whopping $2.3 trillion by 2028.
This means there are a lot of growth opportunities for businesses like yours—whether you're laying the foundations for new homes, offices, or big commercial buildings.
But wait! Before you start measuring profits, it’s crucial to a create solid financial plan that helps navigate costs, avoid expensive surprises, and ensure long-term sustainability in a competitive marketplace.
Wondering how to build a plan?
No worries; this construction financial plan template is here just for help and inspiration right away!
How do you build financial projections for a construction company?
Creating realistic financial projections for your construction company involves thorough analysis and meticulous planning to comprehend its financial health and growth potential.
Here’s a step-by-step guide to help you build accurate and actionable projections while ensuring you factor in every detail:

1. Gather essential information
First, collect all the relevant key data that lays the groundwork for accurate financial projections.
This would include your construction company details like:
- Current operations
- Target demographics
- Historical financial performance
- And industry benchmarks.
Start by looking at your project income—track weekly and monthly revenue trends, busy seasons, and how demand changes throughout the year.
For new construction companies, analyze the latest market trends, industry benchmarks, and local competitors to make educated estimates.
Go deeper into understanding your clients.
- Who are they?
- What types of projects do they need?
- What’s their budget range?
Consider analyzing previous revenues, costs, and profits to detect trends and highlight the areas for improvement. Look at how your marketing efforts, project types, or seasonal demand affected your revenue and costs.
That’s how you'll have everything you need to create accurate and actionable financial projections.
2. Make rough pre-assumptions
Now, make some preliminary assumptions for your construction company’s financial projections based on gathered data. Such estimates will present your business's revenues, expenses, and levels of profitability.
Begin by concentrating on fundamentals: What your monthly revenue will be, how much on average customers will pay, and what your operational costs could be.
Use the knowledge of historical revenue trends, industry benchmarks, and your own research. Also take into account seasonality changes in demand or forthcoming projects that would affect your expenses and revenues.
Here are a few key metrics to consider while making your assumptions:
- Revenue growth: Predict a percentage increase in sales, such as a 5% annual growth based on an expanding customer base or marketing efforts.
- Cost increases: Plan for possible hikes in material prices or labor wages, like a 10% rise in fuel or equipment costs during peak construction seasons.
- Seasonality: Factor in peak periods of high project demand and low months when fewer contracts are executed.
- Economic conditions: Include inflation, increasing wages, or other economic considerations that can affect both costs and the purchasing power of customers.
Don't go for perfection—these are rough estimates to help your planning that will change over time. So, refer back to them from time to time as real data flows in.
3. Make revenue projections
Revenue estimates are all about determining how much money your construction business could generate.
To begin, consider a few basics: How many projects you work on simultaneously, how long they take to finish, and the average revenue per project.
Divided into step-by-step, it is simpler to visualize your earning potential.
If you work on 5 projects simultaneously, each generating $50,000, and they last for 2 months, here's the calculation:
5 projects × $50,000 ÷ 2 months
= $125,000/month
But you also have to consider things such as seasonal demand, changes in the economy, or big contracts—these can secure more projects and boost revenue. Alternatively, slower months or approval delays could decrease income.
Also, look into other sources of income such as equipment rental, subcontracting services, or maintenance contracts, which can give a notable contribution to your overall income.
By including these extra streams, you’ll get a more accurate picture of what your construction company can earn.
Revenue forecasts aren't just a dull exercise in number-crunching—they establish achievable expectations while getting ready for both the peak seasons and the slower ones.
4. Calculate the Cost of Goods Sold (COGS)
The next step is to determine your Cost of Goods Sold (COGS)—essentially, direct costs of project completion. These are the materials, labor, equipment rentals, and subcontractor charges that directly feed into construction labor.
Here's a simple way to perform your COGS calculation:
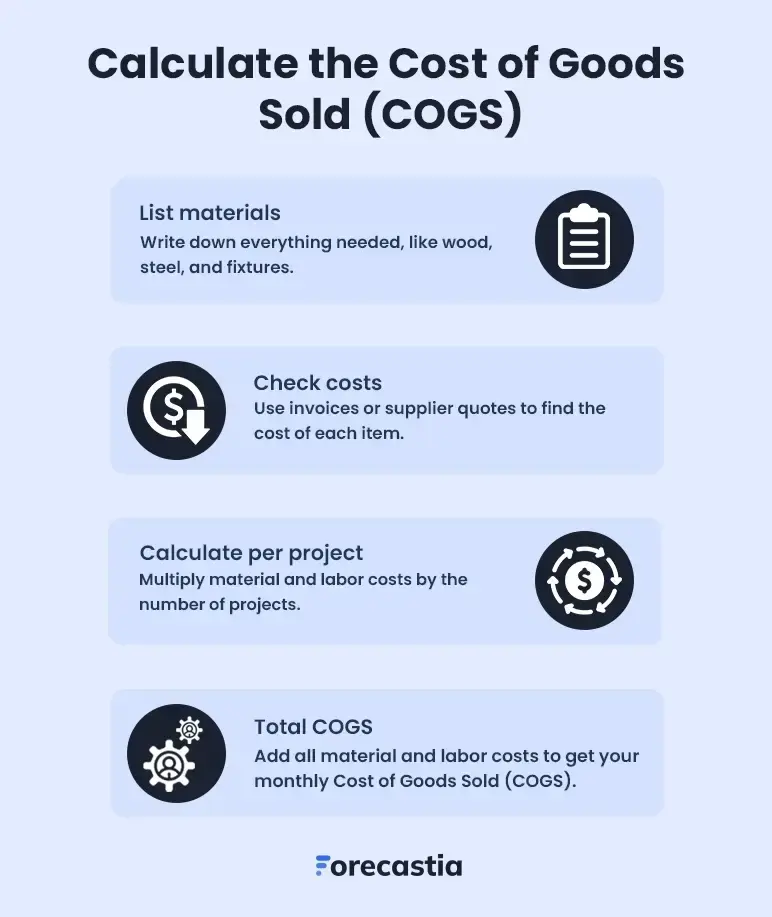
For instance, if your building construction firm uses $200,000 in materials and labor each month yet brings in revenue of $500,000, then your COGS is $200,000.
Understanding your COGS will assist you in controlling costs, better utilizing resources, and increasing profits.
5. Estimate operating costs
Next, describe the expected expenses incurred to operate your construction firm.
Begin by creating a list of fixed costs—these remain the same each month, regardless of the number of projects you handle. For instance: Insurance, rent, equipment leases, and full-time staff salaries.
Then, specify the variable costs, which fluctuate with project demand and workload. For instance: Subcontractor wages, utilities, raw materials, fuel, and advertising costs.
Finally, add the fixed and variable costs together to calculate your total operating costs.
Suppose your construction firm has the following expenses:
- Rent: $12,000
- Utilities: $3,500
- Wages: $35,000
- Other expenses (marketing, insurance, permits, etc.): $4,500
Your total operating expenses would be $55,000 per month.
Overall, by calculating your operating costs, you can manage your budget and know whether your revenues can cover all the expenses to leave room for profit.
6. Prepare financial statements
After calculating your construction company's revenue, COGS, and operating expenses, it's time to create concise financial reports.
These reports are critical in portraying your construction business's health and growth potential to potential investors.
Following are the key financial statements and reports that you must include in your plan:
- Income statement
- Cash flow statement
- Balance sheet
- Break-even analysis
By adding these financial statements, you showcase your financial standing to potential investors so they can make well-informed decisions regarding investment.
We'll explore each of these financial components in greater detail in the upcoming sections, giving you the insights needed to create a strong financial plan.
7. Prepare visual reports
Numbers alone aren't enough. Present your construction company’s financial data in a visually appealing and easily digestible format that readers can quickly understand and use to gain valuable insights.
Using charts and graphs makes it easier to highlight your construction firm’s key aspects, including revenue trends, expenses, profit margins, and cash flow.
Don’t worry; it’s easy. Use simple bar charts, pie charts, and line graphs to make the data clear. Also, highlight patterns like seasonal sales changes or rising costs to help with planning.
This will not only help analyze financial data but also enable you to communicate key metrics effectively to your team as well as investors.
8. Test assumptions, consider scenario analysis
Finally, take a step back and test the numbers to ensure your projections are more accurate. Try to run different scenarios (best- and worst-case) to see how changes impact your financial outcomes.
For example, consider what happens if material costs rise by 15% or if project demand drops during slower seasons.
A spike in steel, lumber, or fuel prices could significantly increase expenses, while fewer contracts in off-peak months could lower revenue.
Considering these “what-if” situations helps you identify potential problems in business operations and come up with solutions in advance. It even increases transparency and lets investors better understand your construction company’s future with different scenarios.
Overall, these test assumptions and sensitivity analyses will help you make strategic decisions and necessary adjustments to keep your construction company running smoothly.
Key financial statements of a construction company financial plan
A comprehensive construction company financial plan usually consists of key financial reports such as the income statement, cash flow statement, balance sheet, and break-even analysis.
These reports explicitly detail your construction company's present monetary situation and the general money plan to reach future objectives.
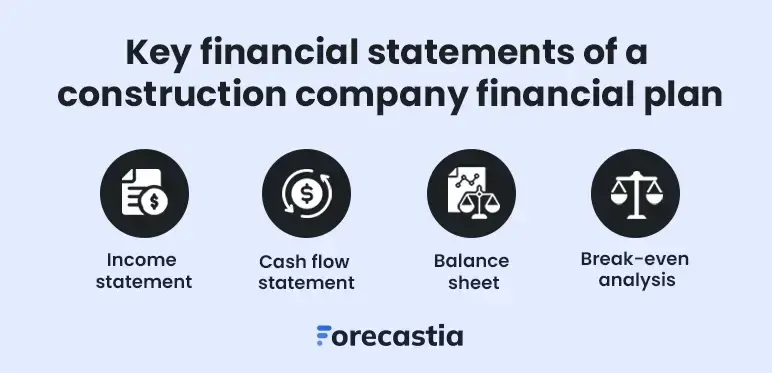
Let's explore each statement in detail.
1. Income statement
The profit and loss statement is also referred to as the income statement. It gives a clear idea about your construction company's revenue, expenses, gross margin, and net profit during a given time.
It assists you in analyzing whether your company is generating sufficient revenues to pay for its expenses and make a profit.
The gross profit is what you get after subtracting the COGS from the total revenue. This shows how efficiently your construction company uses its resources.
Further, divide the gross profit by revenue and convert it into a percentage to determine the gross margin.
Then, subtract operating costs like office rent, salaries, and utilities from your total revenue to calculate EBITDA (Earnings Before Interest, Taxes, Depreciation, and Amortization). This gives you a clear view of your company's profitability before additional expenses.
Finally, subtract interest, taxes, depreciation, and amortization from the EBITDA to arrive at the net profit of your construction company—the figure that investors care about the most.
Here’s an example of a mid-sized construction company’s income statement to show how these calculations work:
| Revenue | Amount |
| Residential Contracts | 500,000 |
| Commercial Contracts | 450,000 |
| Government Contracts | 250,000 |
| Total Revenue | 1,200,000 |
| Cost of Goods Sold (COGS) | |
| Raw Materials | 250,000 |
| Equipment Rental | 120,000 |
| Labor Costs | 130,000 |
| Total COGS | 500,000 |
| Gross Profit | 700,000 |
| Operating Expenses | |
| Office Rent | 50,000 |
| Salaries | 200,000 |
| Marketing | 30,000 |
| Insurance | 20,000 |
| Permits & Licenses | 15,000 |
| Total Operating Expenses | 315,000 |
| Operating Profit | 250,000 |
| Taxes | 50,000 |
| Net Profit | 200,000 |
A construction company generates revenue from residential, commercial, and government contracts, totaling $1,200,000.
The Cost of Goods Sold (COGS) includes raw materials, equipment rental, and labor costs, amounting to $500,000.
After deducting COGS, the gross profit is $700,000.
However, after covering operating expenses like office rent, salaries, marketing, insurance, and permits, the operating profit is reduced to $250,000.
With taxes deducted ($50,000), the final net profit is $200,000, indicating a profitable operation.
In simple terms, the income statement tells you if your construction company is making money and staying financially healthy over time.
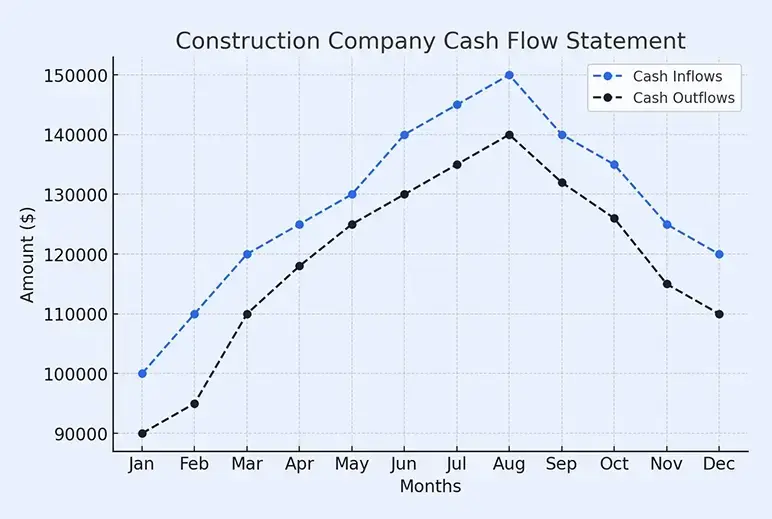
2. Cash flow statement
A cash flow statement reveals where money is going in and out of your construction business during a specific time. It assists you in determining whether you have sufficient cash to meet your daily needs.
It’s also great for spotting potential cash shortages, especially during slower months, and demonstrates how much cash is coming from operations compared to things like investments or loans.
For effective cash flow forecasting, you’ll need to include cash from project contracts, costs like materials and labor, and other overhead expenses such as rent, insurance, and equipment maintenance.
| Month | Cash Inflows ($) | Cash Outflows ($) | Net Cash Flow ($) |
|---|---|---|---|
| January | 100,000 | 90,000 | 10,000 |
| February | 110,000 | 95,000 | 15,000 |
| March | 120,000 | 105,000 | 15,000 |
| April | 130,000 | 115,000 | 15,000 |
| May | 140,000 | 125,000 | 15,000 |
| June | 145,000 | 130,000 | 15,000 |
| July | 150,000 | 135,000 | 15,000 |
| August | 150,000 | 140,000 | 10,000 |
| September | 140,000 | 130,000 | 10,000 |
| October | 130,000 | 120,000 | 10,000 |
| November | 120,000 | 110,000 | 10,000 |
| December | 110,000 | 100,000 | 10,000 |
A commercial construction firm has fluctuating cash inflows and outflows due to contract payments and material purchases.
Breakdown of Monthly Cash Flow:
✔ Cash Inflows
Represent payments from completed projects, client advances, and government contracts.
✔ Cash Outflows
Represent expenses such as material procurement, labor wages, and equipment rentals.
Key Trends:
✔ Peak Revenue Months (June - August):
- Cash Inflows: $140,000 - $150,000
(due to final project payments)
- Cash Outflows: $130,000 - $140,000
(higher due to material purchases and labor expansion)
- Net Cash Flow: Positive, as inflows exceed outflows.
✔ Slower Months (January - February):
- Cash Inflows: $100,000 - $110,000
(fewer new projects).
- Cash Outflows: $90,000 - $95,000
(fixed costs like rent, salaries, and insurance).
Net Cash Flow: Close to break-even, requiring financial planning for cash reserves.
That said, it’s a good illustration of how well your business is at generating cash. The precision of your projections in these aspects directly impacts the reliability of your cash flow.
So, be realistic with the assumptions you make in the cash flow statement. Use industry standards and consider market situations to ensure financial accuracy.
3. Balance sheet
A balance sheet gives a quick snapshot of your construction company’s financial position for a specific timeframe. It shows what the construction company owns, what it owes to others, and what’s left for you.
After all, it covers these key elements:
- Assets: Cash at hand, accounts receivable and property, equipment.
- Liabilities: Financial obligations like short-term debts and long-term loans.
- Equity: The leftover earnings once liabilities are subtracted from assets.
Ideally, it’s presented as, Assets = Liabilities + Equity.
| Category | Amount ($) |
|---|---|
| Assets | |
| Current Assets | |
| Cash & Cash Equivalents | 50,000 |
| Accounts Receivable | 75,000 |
| Inventory (Materials & Supplies) | 40,000 |
| Total Current Assets | 165,000 |
| Fixed Assets | |
| Property & Equipment | 120,000 |
| Vehicles | 60,000 |
| Tools & Machinery | 80,000 |
| Total Fixed Assets | 260,000 |
| Total Assets | 425,000 |
| Liabilities | |
| Current Liabilities | |
| Accounts Payable | 45,000 |
| Short-term Loans | 30,000 |
| Total Current Liabilities | 75,000 |
| Long-term Liabilities | |
| Business Loans | 100,000 |
| Total Long-term Liabilities | 100,000 |
| Total Liabilities | 175,000 |
| Owner’s Equity | |
| Owner’s Capital | 200,000 |
| Retained Earnings | 50,000 |
| Total Owner’s Equity | 250,000 |
| Total Liabilities & Equity | 425,000 |
Investors really pay close attention to the balance sheet because it shows them your construction company’s financial structure, return on investment (ROI), and overall stability.
It also provides an idea of the cash that is available to you, how the money is blocked, and what kind of solid business you are running.
4. Break-even analysis
We all know that profit is the all-time motive of all construction company owners. The real question is: When does the money actually start coming in?
A break-even analysis fits the bill at this stage. It shows exactly how much you’ll need to generate in revenue for all the costs to be recovered—no profit and no loss; just breaking even.
Let's take an example to see how it works.
For a Construction Company:
- Fixed costs: $50,000
(including rent: $20,000, utilities: $5,000, and salaries: $25,000)
- Variable costs: $150,000
(materials, subcontractor wages, equipment rentals)
- Revenue: $400,000
Contribution Margin Calculation:
(400,000−150,000)÷400,000
=0.625 (or 62.5%)
Break-even sales calculation:
$50,000 ÷ 0.625
= $80,000
So, this construction company needs to generate at least $80,000 per month to cover all costs and break even.
This analysis shows exactly how much revenue is needed to reach the point where your total sales just cover your costs, causing no profit or loss.
In addition, this will give potential investors or lenders a fair idea of when your construction company would be profitable.
Download free construction company financial projections example
Creating a construction company financial plan from scratch seems overwhelming. After all, Excel sheets are tiring and endlessly long. But no worries! We’re here to help you with our free construction company financial plan sample.
It covers all the key components of a construction company's financial projection, such as sales forecast, P&L or income statement, balance sheet, cash flows, and break-even analysis, simplifying the entire financial planning process to help you get started.
Build accurate financial projections using Forecastia
That’s it! We’ve discussed almost everything about creating construction company financial projections in this guide. Now, it should be much easier for you to put that knowledge into action and start planning.
But if it still feels like a lot to handle, don’t worry; Forecastia is the only AI-powered financial forecasting tool you need to make the process simple and stress-free.
It’s specifically designed for businesses looking to build accurate financial projections, anticipate future cash flows, and analyze overall financial performance—all without using spreadsheets!
Frequently Asked Questions
What are the key financial statements in a construction company's financial plan?
A construction company's financial plan includes three key statements:
- Income Statement – Tracks revenue, expenses, and profitability.
- Balance Sheet – Shows assets, liabilities, and equity.
- Cash Flow Statement – Monitors incoming and outgoing cash for project expenses and payments.
What are common operating expenses in a construction company's financial plan?
A construction company’s costs can be divided into fixed and variable expenses:
- Fixed costs – Rent, salaries, insurance, equipment leases.
- Variable costs – Materials, subcontractor wages, fuel, and utility costs.
- Other expenses – Permits, marketing, safety compliance, and maintenance.
How do I forecast revenue and expenses for my construction company?
To estimate future revenue and expenses, consider:
- Number of projects and average contract value
- Material and labor costs
- Seasonal demand and industry trends
- Profit margins and break-even analysis
How often should I update my construction company’s financial projections?
Financial projections should be reviewed and updated:
- Quarterly – To track progress and make adjustments.
- When costs change – If material prices, wages, or equipment costs increase.
- For new contracts – When bidding on large projects or expanding services.
How does the construction company financial projections template help?
The template helps you estimate future earnings and costs by:
- Entering expected project revenue – Based on past contracts and market demand.
- Adjusting costs – Factoring in material price fluctuations and labor expenses.
- Reviewing different scenarios – Planning for slow seasons, rising costs, and growth opportunities.

Follow Vinay Kevadiya